Progress:
During the last fifty years, the Agriculture Department has made tremendous progress in agriculture production . The production has increased manifold as is evidence from the information given below.
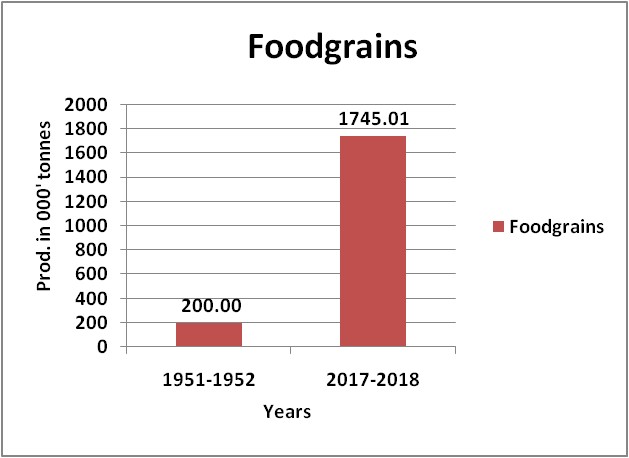
TOTAL FOODGRAINS PRODUCTION
Food grains production increased from 200 thousand tonnes in 1951-1952 to 1745.01 thousand tonnes in the Year 2017-2018.
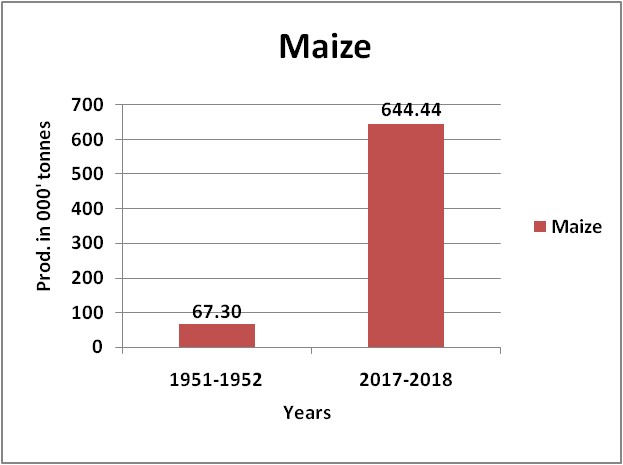
MAIZE PRODUCTION
Maize is the major crop of the state. The production of Maize, which was 67.3 thousand tones in 1951-1952 has gone up to 644.44 thousand tonnes in the year 2017-2018.
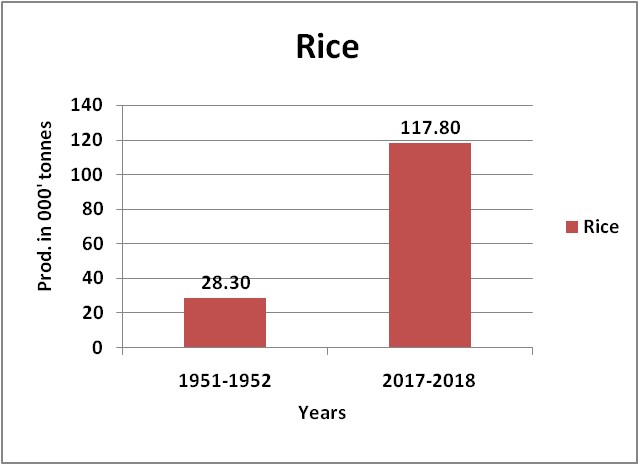
RICE PRODUCTION
The Production of rice has gone up from 28.3 thousand tonnes in 1951-1952 to 117.80 thousand tonnes in 2017-2018.
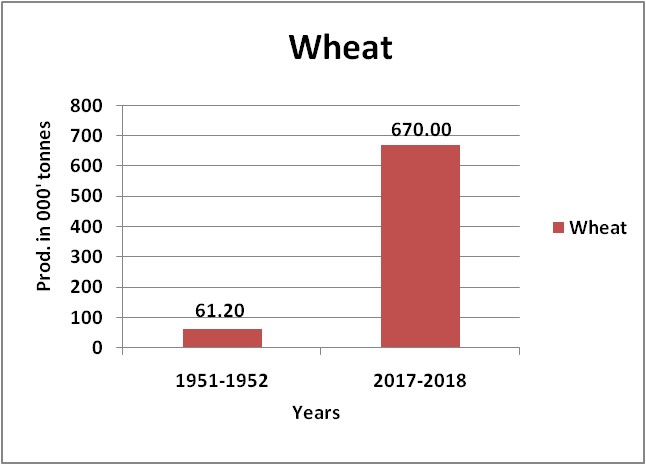
WHEAT PRODUCTION
The production of wheat has attained a level of 670.00 thousand tonnes in 2017-2018 against 61.2 thousand tonnes during 1951-1952.
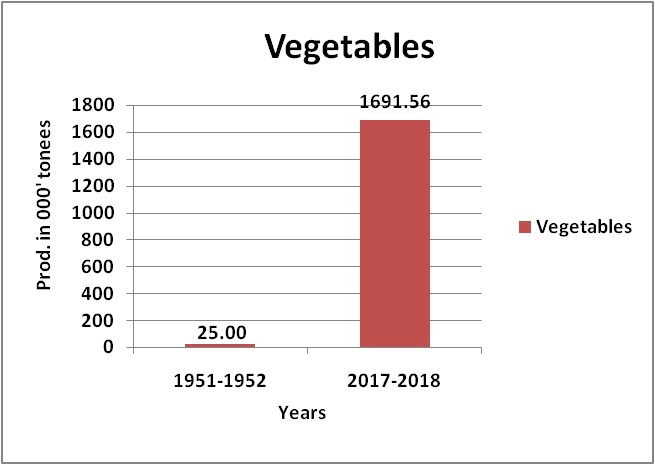
VEGETABLE PRODUCTION
Production increased from 25 thousand tonnes during 1951-1952 to 1691.56 thousand tonnes during 2017-2018.
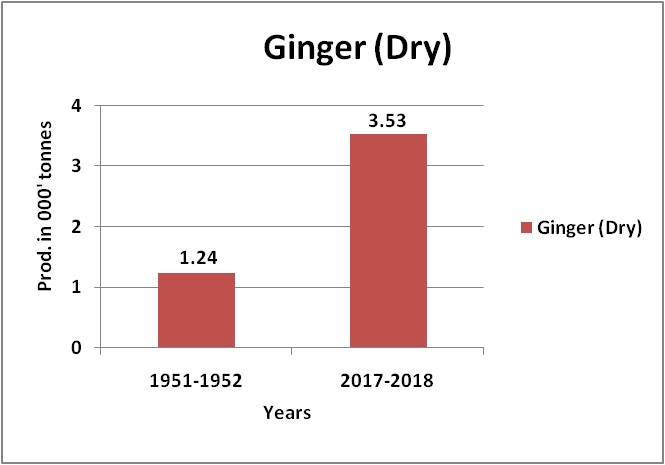
GINGER PRODUCTION (Dry)
The production of Ginger in 1951-1952 was 1.24 thousand tonnes. The production of Ginger in 2017-2018 is 3.53 thousand tonnes.
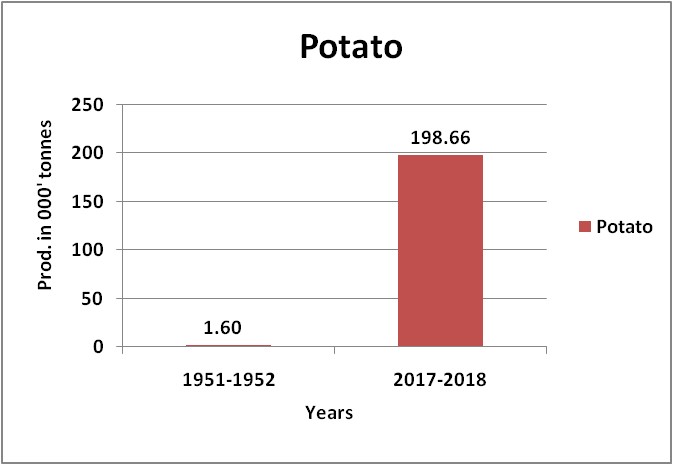
POTATO PRODUCTION
The production of potato was 1.60 thousand tonnes in 1951-1952 and 198.66 thousand tonnes in 2017-2018.
Progress in Respect of Other Programme During 2017-2018
| S.No. | Development Programme | Unit | |
| 1 | Distribution of Improved Seeds | M.T. | 10,210 |
| 2 | i) Distribution of Plant ProtectionMaterial. ii) Area Treated |
M.T. 000' ha. |
135.00 2.80 |
| 3 | Distribution of Fertilizers (In Nutrients) : i) Nitrogen (N) ii) Phosphorous (P) iii) Potassium (K) TOTAL (N+P+K) |
M.T. M.T. M.T. M.T. |
35,000 8,000 8,000 51,000 |
| 4 | Improved Agricultural Implements Distributed including Plant Protection Equipments | No's | 1,20,000 |
| 5 | Area covered under H.Y.V. Programme i) Wheat ii) Rice iii) Maize |
000' ha. 000' ha. 000 'ha. |
360.00 76.10 294.00 |
| 6 | No. of Biogas Plants Installed | No's | 100 |
| 7 | Area to be Covered under Soil and Water Conservation Measures | ha. | 3,600 |
| 8 | Number of Soil Samples Analysed | No's | 50,000 |


